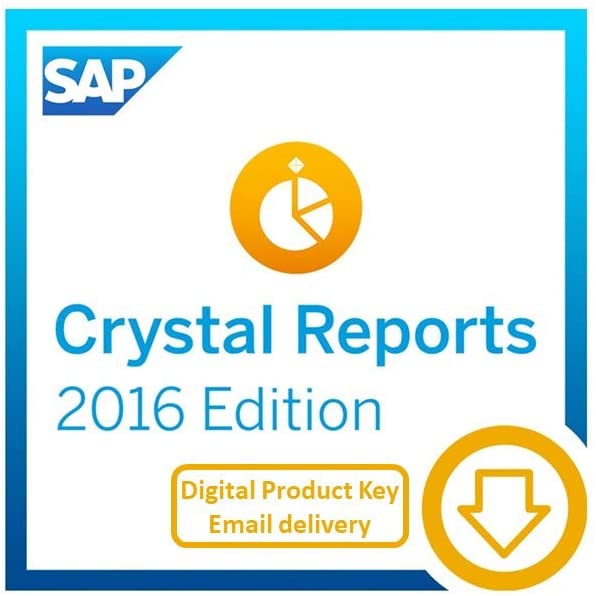
B07K3WFN5T SAP Crystal Reports 2016 Reporting software [32 Bit] [PC Download]
$297.00
SAP Crystal Reports is used on your PC for Reporting, Analytics, Business Intelligence, Decision Support, Data mining, Data analysis and Data warehousing. Since 1991, we successfully market SAP Crystal Reports to small and medium-sized organizations worldwide and count more than 1,000,000 active users.
With SAP Crystal Reports, stored data can be securely accessed in order to analyze facts, visualize trends and patterns, filter, sort or rank that data, go into more details and create grids, tables, charts, graphs, and maps.
Once you have created your tables, your charts and your maps in SAP Crystal Reports, you can combine them into documents. You can design every document you need in a pixel-perfect manner and add your logos, corporate colors and layouts, images, and code-bars.
Examples of pixel-perfect document are reports with one or many pages, a list of invoices to be sent out to customers, a business overview to share with investors. You can also share these documents with other users (inside or outside of your business) in various static and interactive formats.
SAP Crystal Reports turns almost any data source into interactive, actionable information that can be accessed offline or online, from applications, portals and mobile devices.
0
FALSE
0
